Simple Period Tracker I Excel: A Practical Guide to Tracking Your Menstrual Cycle
Tracking your menstrual cycle doesn’t have to be complicated or require a dozen different apps. For many professionals, creators, and entrepreneurs, the simplest tools often integrate best into an existing routine. The Simple Period Tracker I Excel is exactly that: a straightforward, visually clean spreadsheet designed to log your cycle, symptoms, and patterns without the noise of notifications or unnecessary features. It’s a file you control, update at your own pace, and keep completely private on your device.
If you use Microsoft Excel—whether on desktop or via the free mobile app—this template offers a way to turn routine data into a clear, long-term view of your menstrual health. Here’s how it works, where it fits into a broader health tracking process, and how you can implement it without disrupting your existing workflow.
What the Simple Period Tracker I Excel Template Includes
Before diving into use cases, it helps to understand exactly what you get with this digital download. The template is built around a single spreadsheet with a few key components:
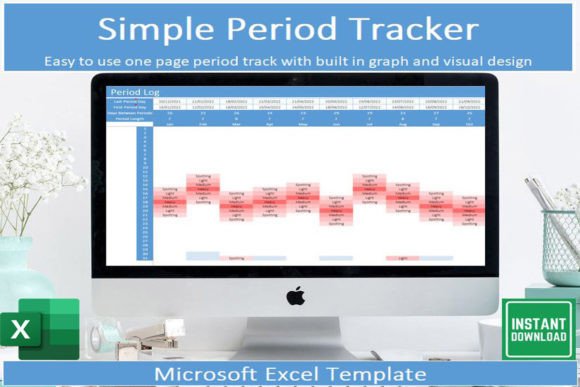
- A visual tracker tab where you log each cycle day, flow level, and symptoms using a clean, color-coded layout.
- Drop-down lists for common entries like flow intensity (light, medium, heavy), symptoms (cramps, headache, bloating, etc.), and mood notes. This speeds up data entry and keeps your records consistent.
- An automatically updating graph that plots your cycle length, symptom frequency, or flow patterns over time. As you add data, the chart refreshes without any manual work.
- Instructions explaining each field and how to use the template effectively.
Because the file lives in Excel, you can store it locally, back it up to your cloud service of choice, or open and edit it on your phone using the free Microsoft Excel app. There’s no dependency on a proprietary platform or a company’s privacy policy—your cycle data stays with you.
Where the Simple Period Tracker Fits in Your Broader Health Workflow
The most effective health tracking tools are those that slot into an existing routine without adding friction. The Simple Period Tracker I Excel works well as a standalone log, but it also complements other methods and tools you might already be using.
For example, you might combine it with:
- A digital calendar (Google Calendar, Outlook) for predicting your next period start date based on the cycle lengths you log in the tracker.
- A notes app for deeper journaling about energy, productivity, or emotional patterns, with the tracker serving as the structured data layer.
- A wearable device that records sleep or heart rate; you can cross-reference those metrics with your logged cycle phases to spot correlations.
- A healthcare provider’s portal if you eventually share summary reports—the graph alone can give a clinician a solid overview of your cycle regularity.
Think of the tracker as the structured record in your personal health system. It captures the quantifiable aspects of your cycle, while other tools handle context and nuance. This separation keeps the spreadsheet clean and fast to update, which is important when you only have a minute to log your data.
Using the Tracker Before, During, and After Key Activities
One of the strongest reasons to track your cycle is to understand how it influences your energy, focus, and physical well-being. The Simple Period Tracker I Excel supports this across three timeframes: before an event, during it, and after.
Before: Planning Around Your Cycle Phases
If you know your typical cycle length and symptoms, you can plan high-focus work, travel, or exercise around your highest-energy days. After a few months of logging, you’ll be able to look at the graph and predict when you’re likely to feel your best—and when you might need to schedule lighter tasks.
For instance, a freelancer might use the tracker to identify that the week after their period ends is their most productive window, and then block that time for deep work. A small business owner might notice that certain symptoms consistently appear around day 21, and plan client meetings accordingly. The spreadsheet gives you the data to make these decisions confidently, instead of relying on memory or guesswork.
During: Real-Time Logging Without Friction
When you’re in the middle of your cycle, the last thing you want is a complex data entry process. The Simple Period Tracker I Excel is designed for speed. Open the file on your phone or laptop, use the drop-down lists to select your flow level and any symptoms, and close it. The whole interaction can take under thirty seconds.
The drop-down lists reduce typos and inconsistency, which matters when you look back at three months of data. If you always select “light” instead of typing “light flow” one day and “barely there” the next, your graph will show a reliable pattern. The template keeps that consistency built in from the start.
After: Reviewing Trends and Adjusting Your Approach
Once you’ve logged a few cycles, the automatically updating graph becomes your most valuable asset. It lets you see, at a glance, whether your cycle length is stable, whether certain symptoms cluster at the same point each month, and whether your flow follows a predictable pattern.
You might use this review phase to adjust your supplement routine, change your exercise schedule, or prepare for an upcoming doctor’s appointment. The graph provides a visual record that’s much easier to interpret than a list of dates and notes.
Practical Implementation Tips for a Smooth Routine
Integrating a new tracking tool into your daily life is often the hardest part. The Simple Period Tracker I Excel is forgiving because it doesn’t require daily attention—you only need to log when your period starts, ends, and on the days you experience notable symptoms. Here are a few ways to make it stick:
Set Up Your Spreadsheet Once, Then Forget It
When you first download the template, open it in Excel and customize the drop-down lists to match your personal vocabulary. If the default symptoms don’t cover what you experience, edit the list by going into Excel’s Data Validation settings. This upfront investment means you’ll never have to type the same word twice.
Also, decide where you’ll store the file. A cloud folder (OneDrive, Google Drive, Dropbox) syncs across devices, so you can log from your phone during a commute or from your laptop during a quiet morning. The free Microsoft Excel app for mobile is sufficient for editing and viewing the file—no subscription required.
Build a Logging Trigger, Not a Routine
Instead of telling yourself to log “every day,” tie the action to an existing trigger. For example, log your symptoms when you brush your teeth at night, or log your flow level when you change your menstrual product. The trigger becomes the reminder, and the template is the fast tool you use to record it.
If you miss a day, don’t backtrack. The template works with imperfect data. Over several months, a few missing entries won’t distort the overall pattern. Consistency beats perfection.
Use the Graph as Your Motivation
After two or three cycles, the graph starts to show real trends. Checking your updated graph once a month can be surprisingly motivating—it makes the effort of logging feel worthwhile. You might notice that your cycle is more regular than you thought, or that a specific symptom appears like clockwork. That feedback loop encourages long-term use.
Long-Term Benefits and Consistency
The real value of the Simple Period Tracker I Excel emerges after six months to a year of use. A single month of data gives you a snapshot. Twelve months give you a reliable baseline. With that baseline, you can:
- Predict your next period start date with greater accuracy, which helps with travel planning, project deadlines, and social commitments.
- Identify subtle changes in cycle length or symptom severity that might warrant a conversation with a healthcare provider.
- Separate one-off anomalies from genuine shifts in your body’s patterns. A short cycle once might be stress-related; short cycles every third month might indicate something else.
- Share a clear summary with a doctor or specialist. The visual graph and consistent drop-down tags are much easier to discuss than a handwritten journal.
Because the template lives in Excel, you control the data indefinitely. There’s no subscription fee, no data export limit, and no risk of a company changing its privacy policy. For people who value long-term ownership of their personal information, this is a significant advantage.
Compatibility and Practical Considerations
The Simple Period Tracker I Excel requires Microsoft Excel to function. If you use a Mac, Windows PC, or mobile device with the free Excel app, you’re covered. The template relies on standard Excel features—drop-down lists, conditional formatting, and chart functions—so it works across recent versions of the software.
One practical note: because the template uses macros or dynamic chart ranges in some versions, ensure your Excel security settings allow the chart to update when you add new rows. The included instructions usually cover this step. If you’re unfamiliar with Excel’s data validation, the template’s built-in drop-downs are already configured—you just need to select from them.
If you share your computer or use a work device, the file can be stored in a password-protected folder or on a personal cloud drive. No data is sent to any external server unless you choose to sync it yourself.
Final Observations on the Simple Period Tracker I Excel
A menstrual cycle tracker doesn’t need to be complicated to be useful. The Simple Period Tracker I Excel proves that a well-structured spreadsheet, combined with thoughtful drop-down options and an auto-updating graph, can give you all the insight you need without demanding constant attention.
It works because it fits into the way many of us already work: we open a file, enter a few pieces of data, and let the tool handle the organization. Over time, the spreadsheet becomes a personal reference that helps you make better decisions about your health, productivity, and daily planning.
If you value privacy, simplicity, and long-term data ownership, this template is worth integrating into your routine. Set it up once, log when you can, and let the graph reveal the patterns you might otherwise miss.