Why Digital Marketing Infographic Template V Changes How You Present Data
If you have ever tried to explain a campaign result to a stakeholder who glazed over the moment you mentioned conversion rates, you already understand the problem. Raw numbers rarely persuade. What does persuade is a clear visual story. Digital Marketing Infographic Template V exists to bridge that gap between data and decision-making. It is not just another design file. It is a structured way to take metrics, trends, and campaign results and turn them into something people actually want to look at. Marketers, strategists, and social media managers are picking it up because it saves time and improves clarity. But like any tool, how you use it matters more than the fact that you have it. Many people download a template and expect instant magic. The real value comes from understanding what the template offers and what it does not.
What Digital Marketing Infographic Template V Actually Does
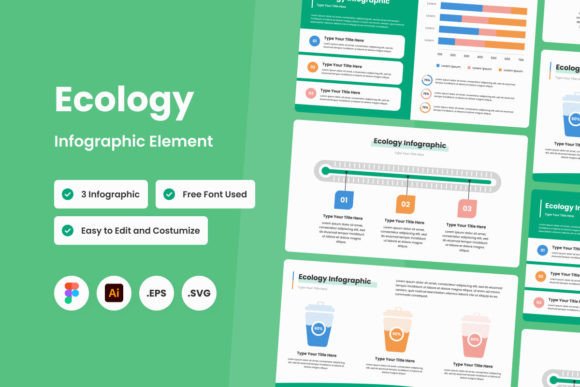
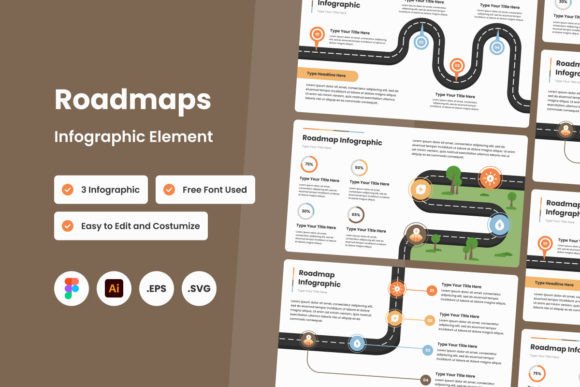
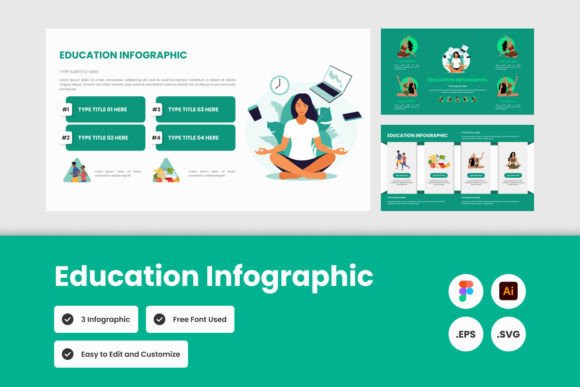
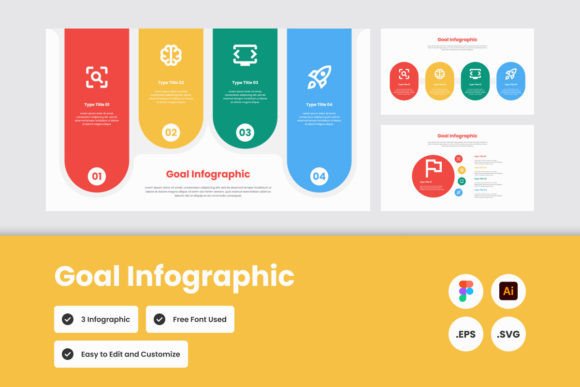
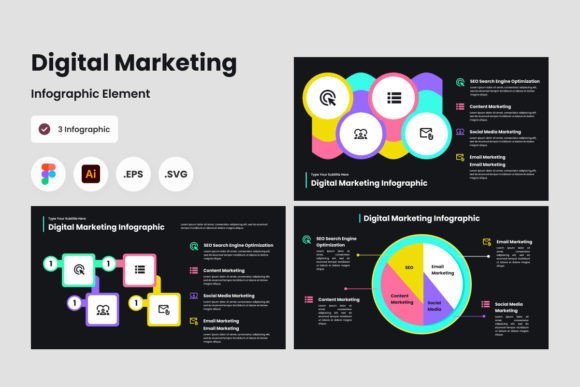
At its core, this template provides a framework for organizing information visually. It comes in three distinct design variations, which means you are not locked into one layout. Whether you are reporting on quarterly ad spend, showing content performance, or mapping out a funnel, you can pick the variation that fits the story you want to tell. The files are delivered in .Fig, .Ai, .Eps, and .Svg formats. That covers most design workflows, whether you use Figma, Illustrator, or another vector-based tool. All layers are neatly organized, so you are not digging through unnamed groups trying to find the text box that holds your headline. The fonts used are open source, meaning you do not need to worry about licensing or hunting down missing typefaces. These are practical features that many templates overlook.
But here is where people stumble. They assume that because the template looks polished in the preview, their own data will automatically look the same. The preview images are for illustration only. The template does not include those stock photos or generic icons. What you get is the structure, the layers, and the design system. You provide the content, the images, and the final polish. That distinction is important because it affects how you plan your project. If you expect to drop in a few numbers and print, you will be disappointed. If you expect a solid foundation that you can build on, you will be satisfied.
Choosing the Wrong Variation for the Data
The template includes three unique designs, but not every design fits every dataset. A common mistake is picking the version that looks the most visually striking rather than the one that best organizes the information. For example, one variation might lean heavily on comparison charts. If your data is a single time series, forcing it into a comparison layout creates confusion. Another variation might prioritize hierarchy and steps. If your data is comparative, that layout will feel cramped. Before you download, take a minute to think about what your data is trying to say. Is it a trend over time? A ranking of channels? A breakdown of budget allocation? Match that to the design that supports it best.
The consequence of ignoring this step is a final graphic that feels off. Viewers might not be able to articulate why, but they will struggle to extract the key insight. You lose the whole point of using an infographic in the first place. To avoid this, open all three variations side by side and map your main data points to the available spaces. If it does not fit naturally, you are better off choosing a different layout or customizing the template more aggressively.
Overlooking Layer Organization
One of the selling points of Digital Marketing Infographic Template V is that all elements are well organized. That is a huge time-saver, but only if you respect that organization. A mistake I see often is someone opening the file and immediately moving elements around without looking at the layer structure first. They drag a text box, accidentally move a background element, and then spend twenty minutes trying to put everything back. The layers are named for a reason. Use them. If you are not familiar with how layers work in your design software, take five minutes to learn the basics before you touch the template.
When you ignore the layer structure, you break the relationships between elements. A heading that was aligned to a guide might shift, or a chart might detach from its labels. That increases the time you spend fixing issues that were never issues in the first place. The better approach is to duplicate the file, lock layers you do not need to edit, and work methodically. This preserves the original structure and gives you a fallback if something goes wrong.
Using Too Much Text
Infographics are visual tools, not documents. A frequent misunderstanding is that an infographic should include all the context and explanation you would put in a report. That is a mistake. When you try to cram every detail into the template, the design feels crowded, and the key message gets buried. The template was built to highlight key metrics and trends, not to replace a written analysis. If you find yourself shrinking font sizes to fit paragraphs, you are misusing the format.
A better approach is to treat the infographic as a summary. Use the space to highlight the most important numbers, comparisons, or insights. If you need to provide context, include a short companion document or a footnote. The infographic should make someone want to ask questions, not answer all of them at once. When you respect the visual nature of the format, your audience retains more and engages longer.
Ignoring Font and Color Consistency
The template uses open source fonts, which is a great feature because anyone can access them. But some people replace those fonts with alternatives that do not match the design or that cause spacing issues. Similarly, they might change the color palette without considering contrast or brand alignment. The result is an infographic that looks disjointed. The template is designed with a particular visual rhythm. Changing fonts arbitrarily can break that rhythm and make the graphic look amateurish.
What you should do instead is stick with the recommended fonts unless you have a strong reason to change them. If you must use different fonts, test them at multiple sizes and check that they render consistently across formats. For colors, use the template palette as a starting point and adjust only as needed for brand requirements. Keep enough contrast for readability, especially for charts and data points. A small investment in consistency makes the final product look intentional rather than cobbled together.
Neglecting File Format Compatibility
The template comes in four formats: Fig, Ai, Eps, and Svg. That covers a lot of ground, but not every version of every software handles these files the same way. An .Ai file created in a newer version of Illustrator might not open correctly in an older version. An .Eps file might render differently depending on the software you use. A common oversight is downloading only one format without checking whether your software handles it properly. That can lead to frustration and wasted time.
To avoid this, download the format that matches your primary design tool. If you use Figma, the .Fig file is your best bet. If you use Illustrator, go with .Ai. If you use something less common, Svg is usually a safe fallback because it is widely supported. Test the file early in your process, not at the last minute when you need to deliver. That gives you time to request a different format or adjust your workflow.
Expecting the Template to Do the Thinking
Perhaps the most overlooked detail is that a template, no matter how well designed, does not replace strategy. Some people download Digital Marketing Infographic Template V and expect that filling in the blanks will automatically produce a compelling story. It will not. The template gives you a container. You still need to choose which metrics matter, how to frame them, and what action you want your audience to take. If you throw in random data points, the infographic will look organized but say nothing.
The fix is simple. Before you open the template, write a one-sentence summary of what you want the infographic to communicate. Then select data that supports that sentence. If a number does not advance the story, leave it out. The template works best when you bring clarity to it, not when you hope it will create clarity from chaos. Trust the structure, but own the message.
What to Check Before You Commit to a Template
Before you download any infographic template, including this one, ask yourself a few practical questions. Does the layout match the type of data you typically present? If you mostly show monthly trends, look for a design that emphasizes timelines. If you compare channels or campaigns, look for layouts with side-by-side comparisons. The three variations in this template cover a range, but you should confirm that at least one fits your most common use case.
Check the file formats against the software you actually use. If you only have access to free tools, verify that those tools can open the files without losing elements. Figma can handle .Fig files natively, but if you use Inkscape, you might need .Svg. Also check whether the template requires specific plug-ins or font installations. The open source fonts are a bonus because they remove one barrier, but you still need to install them if you do not already have them.
Look at the level of customization you need. The template claims easy customization, and that is true for basic edits like changing text and colors. But if you plan to heavily modify the layout, add new elements, or rearrange the structure, you will need some design skills. That is not a flaw of the template. It is a realistic expectation. Knowing this ahead of time helps you budget your effort appropriately.
Also consider the context where you will use the infographic. Will it be printed, displayed on a screen, or embedded in a presentation? Each medium has different resolution and sizing requirements. The template is scalable because of the vector formats, but you still need to set the right dimensions and export settings. A common mistake is designing for screen and then printing without checking resolution. Plan your output format from the start.
Practical Advice for Getting the Most Out of the Template
Start with a clear outline. Decide on the key message and the three to five data points that support it. Then open the template and place those data points into the structure. Resist the urge to design as you go. The design is already done. Your job is to align content with the existing layout. That is faster and produces better results than trying to invent something new.
Use the neat layer structure to your advantage. Lock layers you do not need to touch. Duplicate the file before making major changes. Keep a backup of the original template in case you want to start over. Small workflow habits like these save significant time when you are under deadline.
Test your export early. Export one version of the infographic in your intended format and check it on the device or medium where it will be viewed. Adjust fonts, colors, or spacing based on that test. Do not wait until the final version to discover that text is too small or colors look different on screen.
Finally, use the template consistently across multiple projects. The three variations give you flexibility, but sticking with a familiar design language builds recognition. Your audience will start to associate that visual style with your work, which adds credibility over time. That is a benefit that goes beyond any single graphic.
Why This Approach Works Better Than Starting from Scratch
Creating a professional infographic from scratch takes hours. You have to plan the layout, set up grids, choose colors, select fonts, and build every element. Most marketers and small business owners do not have that kind of time. Digital Marketing Infographic Template V removes the structural work so you can focus on content and messaging. That is its real value. It is not a magic wand, but it is a reliable head start.
Where people go wrong is treating it as a final product rather than a starting point. The best results come from people who understand that a template provides the foundation, but their own judgment provides the polish. Choose the right variation, respect the layer structure, keep text concise, maintain consistency, and test your output. Those steps are not complicated, but they are often skipped. Skipping them leads to frustration and underwhelming results. Following them leads to infographics that actually communicate what you need them to communicate.
If you are tired of data that falls flat and presentations that do not stick, a well-used infographic template is one of the most practical tools you can add to your workflow. It does not require you to become a designer. It only requires you to think before you fill in the blanks. That is a skill you already have. The template just gives you a better place to put it.