Visual Process Infographic Template V2: Making Complex Ideas Feel Simple
Some ideas are easy to explain. Others need a map. If you have ever tried to walk someone through a multi-step workflow, a trend that shifts over time, or a system with moving parts, you know the feeling of watching their eyes glaze over. That is where Visual Process Infographic Template V2 comes in. It is a set of design files that helps you turn abstract data into something people actually want to look at. It is not just about making things pretty—it is about making them click.
What This Template Actually Is (And Is Not)
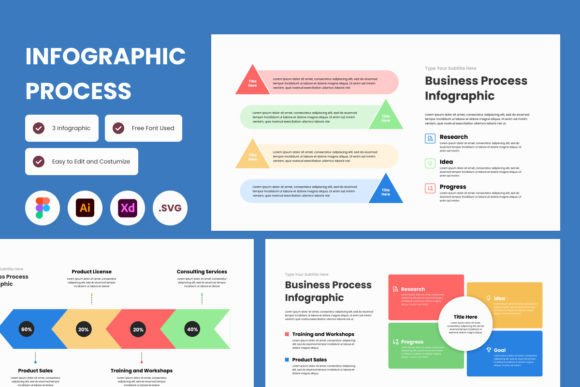
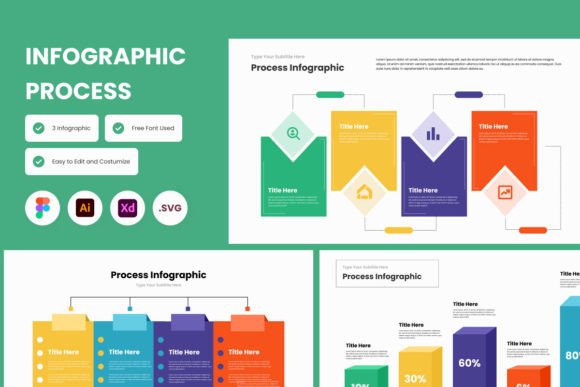
This is a high-quality screen layout design that comes in .fig, .xd, .ai, and .svg formats. That means you can open it in Figma, Adobe XD, Adobe Illustrator, or anything else that supports those files. The fonts are open source, so no licensing headaches. The design is easy to adjust—colors, text, shapes, icons, all movable. You are not locked into anything. What it is not is a one-click solution. You still need to bring your own content and think about what you want to communicate. But the heavy lifting of layout, hierarchy, and visual structure is done for you.
Where This Template Fits Into Real Work
The beauty of this template is that it does not scream for attention. It works quietly in the background of presentations, reports, dashboards, and one-pagers. Let us look at some real-world situations where it becomes more than a nice-to-have.
1. Walking Through a Workflow Without Losing People
Imagine you are a project manager explaining a new onboarding process to your team. There are approvals, handoffs, automated steps, and manual checkpoints. If you use bullet points, people will read them once and forget half. If you use a visual process infographic, they see the flow. They see where their part fits. They see the dependencies. With Visual Process Infographic Template V2, you can map that process in a way that feels natural. You add your steps, connect them with arrows or paths, and the template handles the spacing and alignment. The result is a diagram that looks like it took hours, when really you just dropped in your content.
One user I spoke to used it to explain a software deployment pipeline. She said the team finally understood why certain approvals were needed—not because she said it louder, but because the visual showed the bottleneck. That is the kind of subtle power this template has.
2. Showing Trends Without Burying People in Numbers
Data analysts and business intelligence professionals often face a dilemma: show the full dataset and risk overwhelming your audience, or simplify and risk losing nuance. An infographic can bridge that gap. With this template, you can create a visual trend line that highlights key points—peaks, dips, seasonal changes—without stripping away the context. The layout is designed for clarity, so you can place annotations, callouts, and legends where they belong. The result is a slide that tells a story, not just a chart.
For example, a marketing manager used the template to present quarterly engagement metrics. Instead of a bar chart that blended into the background, she created a timeline-style infographic. The board could see the launch dates of campaigns, the corresponding upticks, and the natural drop-offs. The visual did the explaining for her.
3. Simplifying Complex Systems for Stakeholders
If you work in operations, logistics, or IT, you deal with systems that have many inputs, outputs, and feedback loops. Explaining those to someone outside your function is risky. You either skip details and risk misunderstanding, or include too many and risk confusion. Visual Process Infographic Template V2 gives you a middle ground. Its design supports layered information—you can use a macro-level view with a few summary boxes, then zoom in with sub-diagrams or callout arrows. The template’s hierarchy helps the eye move from big picture to detail without getting lost.
A supply chain analyst I know used it to map the flow from supplier to customer, including exception handling. He admitted that before, he would have just drawn it by hand in a meeting. Now he sends a polished infographic before the meeting, and people come with questions already answered.
Different People, Different Wins
Not everyone uses this template the same way. That is a good thing. Let us break down how various roles might benefit.
- Freelance designers and consultants: You can use the template as a starting point for client deliverables. Edit the colors to match brand guidelines, replace placeholder text with real copy, and you have a custom infographic in a fraction of the time. Clients appreciate when work looks intentional. This template helps you deliver that without reinventing the wheel for every project.
- Educators and trainers: Whether you teach in a classroom or facilitate corporate workshops, a visual process is more memorable than a handout. The template works well for step-by-step instructions, learning pathways, or comparison charts. You can adapt it for both digital slides and printed materials. The open source fonts mean no font substitution issues when you send files to different people.
- Startup founders and product managers: Pitch decks and internal roadmaps often need to show where the product is going. A process infographic can illustrate development stages, user journeys, or rollout plans. The template’s professional look helps you appear organized even if your actual process is still evolving. It buys you credibility while you figure things out.
- Content creators and bloggers: If you publish how-to guides, explainers, or listicles online, a custom infographic can boost engagement. Readers who skim will pause on a visual. This template lets you create those visuals without needing advanced design skills. Export as SVG for crisp display on any device.
Things Worth Considering Before You Jump In
No tool is perfect for everything. Visual Process Infographic Template V2 is strong, but it helps to know its edges.
First, the template assumes you have basic familiarity with the design software you are using. If you have never opened Figma or Adobe XD, there will be a learning curve—not for the template itself, but for the interface. The files are well-organized, but you still need to know how to select layers, change colors, and export. Plan for a short ramp-up time if you are new to the software.
Second, the template is designed for screen layouts. While you can print from those files, you may want to adjust resolution or margins for physical output. The template is not specifically optimized for print, but with a little tweaking, it works fine. Just be aware if your primary use case is large-format posters or brochures.
Third, the template gives you structure, not content. You are responsible for the accuracy and clarity of the information you put in. A beautiful infographic with wrong data is still wrong. Do not let the visual polish override your judgment. Always double-check your numbers, steps, and labels.
Also, while the template is flexible, it is not completely modular. If you want to drastically rearrange elements or change the layout style, you may end up doing more work than starting from scratch. The strength is in its pre-built harmony—use it as a framework, not a constraint. Small tweaks are easy; major overhauls are possible but require effort.
How to Make the Most of It
To get real value, start with your message. What is the one thing you want someone to take away from this infographic? Write it down. Then open the template and see which layout variation fits that purpose. The template includes multiple pages or artboards—each with a different arrangement of boxes, arrows, and callouts. Pick the one that feels closest to your need. Then replace the placeholder text with your content. Adjust colors to your brand or audience. Use consistent icon styles. Keep the font choices simple—open source fonts like those in the template are designed for readability.
One practical approach is to create a rough sketch on paper first. It does not need to be pretty. Just map out where you want the main steps, the flow direction, and any annotations. Then use the template to make that sketch look professional. This two-step process—thinking first, designing second—yields the best results.
Also, remember that white space is not wasted. The template already includes generous margins and breathing room. Do not fill every empty spot with extra text or images. Let the visual breathe. Your audience will thank you.
Strengths That Stand Out
- Cross-platform compatibility: Because the template comes in .fig, .xd, .ai, and .svg, you are not tied to one ecosystem. Work on Windows, Mac, or even online editors like Photopea for SVG files.
- Open source fonts: No worrying about missing fonts or licensing costs. The fonts are free and commonly available.
- Adjustable without frustration: Layers are named, groups are logical, and colors are easily swapped. You can spend minutes instead of hours getting a consistent look.
- Professional polish: The template uses modern design principles—consistent spacing, balanced proportions, clear hierarchy. Your final output will look like it came from a design agency.
Potential Limitations to Keep in Mind
- Not a magic bullet for complex data: If you have extremely dense information, a single infographic may still be overwhelming. Use it as a summary tool, not a data dump.
- Requires some software literacy: If you are completely new to design tools, the first ten minutes will be slow. Tutorials and guides for Figma or Illustrator are widely available, but factor that in.
- Limited to the provided layouts: You can modify them, but the core layouts are fixed in their structure. If you need a completely different visual metaphor (like a tree diagram or a circular cycle), you would need to adapt substantially.
Overall, Visual Process Infographic Template V2 is a practical resource for anyone who needs to communicate processes or trends clearly. It saves time, reduces friction, and helps you produce visuals that people actually want to look at. Whether you are prepping a quarterly review, a training module, or a client proposal, having a solid template in your toolkit means you can focus on the content that matters.