Circle Process Infographic Template V2: A Practical Guide to Visual Communication
When you need to explain a sequence of steps, illustrate a cycle, or show how different phases connect, the choice of visual format matters. A simple list might feel flat, and a basic flowchart can become cluttered. The Circle Process Infographic Template V2 offers a structured yet flexible way to present information in a loop or progression, helping viewers grasp relationships between stages without getting lost in dense text.
What the Circle Process Infographic Template V2 Offers
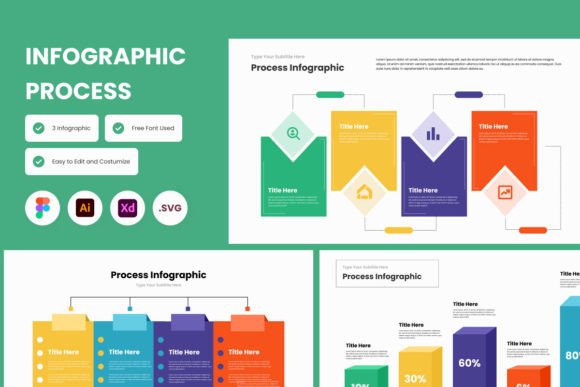
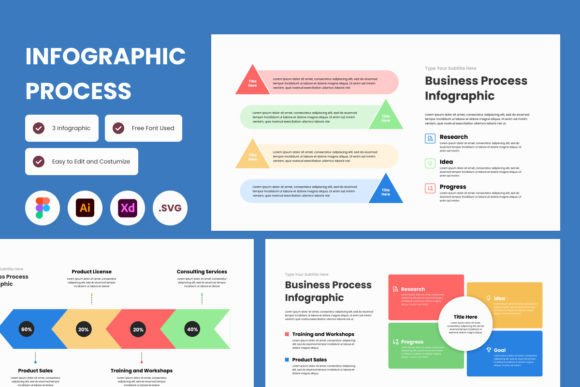
At its core, the Circle Process Infographic Template V2 is a pre-designed layout that organizes content around a circular flow. Unlike linear diagrams that move strictly from left to right or top to bottom, this template uses a cyclical arrangement. That makes it particularly useful for processes that repeat, feed back into themselves, or represent ongoing workflows. The design files come in .fig, .xd, .ai, and .svg formats, which means you can open them in Figma, Adobe XD, Adobe Illustrator, or similar vector editing tools. The template uses open source fonts and a high-quality screen layout, so adjusting colors, text, and iconography is straightforward.
What sets this version apart from basic circular diagrams is the attention to spacing, visual hierarchy, and readability. Each segment of the circle is proportioned to hold content without crowding, and the layout guides the eye naturally from one step to the next. Whether you are mapping a product development cycle, a customer journey, or a project timeline, the structure reduces the effort needed to create a polished visual from scratch.
Comparing Circular Infographics with Other Visual Formats
To decide whether the Circle Process Infographic Template V2 is the right tool for a given task, it helps to compare it with alternative formats commonly used for process communication.
Circular vs. Linear Flowcharts
Linear flowcharts work well for processes that have a clear start and end, such as a step-by-step approval workflow or a sequence of manufacturing stages. They excel when the direction is strictly forward and there is no looping back. However, linear diagrams can feel restrictive when a process naturally repeats or cycles. A circular format, like the one offered by this template, accommodates repetition and feedback loops more naturally. If your content involves continuous improvement, recurring tasks, or iterative phases, the circular approach often communicates the message more accurately.
Circular vs. Timeline or Roadmap Layouts
Timeline layouts are effective for showing chronological progression, especially when dates and durations matter. They emphasize sequence and milestones. A circular process diagram, by contrast, deemphasizes specific dates and focuses instead on the relationship between phases. If your audience needs to see how each step connects to the next without being distracted by exact timing, the circle format keeps the emphasis on the logic of the process rather than the calendar.
Circular vs. Hierarchy or Pyramid Diagrams
Hierarchy diagrams are designed to show rank, priority, or nested relationships. Pyramid layouts work well for layered information, such as Maslow's hierarchy of needs or organizational structures. A circular process diagram is not suited for showing levels of importance or reporting structures. If your content is about levels rather than cycles, a different template category would serve you better. Recognizing this distinction helps you avoid forcing content into a shape that misrepresents the underlying logic.
Strengths of the Circle Process Infographic Template V2
- Visual coherence: The circular arrangement naturally suggests continuity and connection. Viewers can see the whole process at a glance and understand that each stage relates to the others.
- Customization flexibility: Because the template is available in multiple file formats, you can adapt it to your brand colors, typography, and icon style without starting from zero. The open source fonts mean no licensing issues when sharing or publishing.
- Time savings: Designing a balanced circular layout from scratch requires careful alignment and spacing. This template provides a tested structure, so you can focus on content rather than layout mechanics.
- Versatility across contexts: Whether you are preparing slides, reports, social media graphics, or internal documentation, the screen layout is optimized for readability on digital displays. It works equally well for detailed stages or high-level overviews.
Tradeoffs and Limitations to Consider
No single template fits every situation, and the Circle Process Infographic Template V2 has constraints worth understanding.
Limited text capacity per segment. Each segment of the circle has a finite area. If you need to include lengthy explanations, bullet points, or detailed data within each step, the circular format may feel cramped. In such cases, a linear flowchart with expandable boxes or a combination of a circle overview with supporting text panels might be more practical. The template works best when each stage can be summarized in a few words or a short phrase, supplemented by notes outside the diagram.
Not ideal for strictly linear processes. If your content has no cyclical or repeating element, forcing it into a circle can confuse viewers. For example, a process that proceeds from research to design to testing to launch with no return loop may be better served by a horizontal timeline or a step diagram. The circle format implies connection and recurrence, so use it only when that implication matches your message.
Software dependency. The template is built for Figma, Adobe XD, and Adobe Illustrator. If you do not have access to these tools or are unfamiliar with vector editing, you may face a learning curve. While the included .ai and .svg files offer broad compatibility, some adjustment may be needed in other software. Teams that rely on presentation tools like PowerPoint or Google Slides can still use the template by exporting the SVG and importing it, but some editing flexibility will be lost.
Screen-optimized layout. The template is designed for screen display, not for large-format print. If you need a poster or a printed handout, you may need to scale the design and verify resolution. The high-quality layout translates well to digital projection and web use, but print applications require additional testing.
When This Template Is the Right Choice
The Circle Process Infographic Template V2 is a strong fit in several common scenarios:
- Introducing a recurring workflow: For example, showing a quarterly planning cycle that repeats with adjustments each time. The circular shape naturally communicates that the process is ongoing.
- Mapping customer or user journeys: Many customer journeys involve repeated touchpoints, feedback loops, and iterative interactions. A circular diagram can capture that dynamic more accurately than a linear flowchart.
- Explaining a continuous improvement model: Frameworks like Plan-Do-Check-Act or Agile sprints are inherently cyclical. The circle format aligns with their structure and helps audiences internalize the loop.
- Presenting project milestones in a connected way: If milestones feed into each other and the project has phases that overlap, the circular layout can show interdependence without implying strict chronological order.
When You May Need a Different Approach
There are also situations where an alternative format would serve you better:
- Detailed step-by-step instructions: If each step requires multiple sub-steps, warnings, or conditional branches, a linear flowchart or a numbered list with expanded notes is more practical.
- Comparing multiple options side by side: A circular diagram focuses on a single process. For comparing two or more processes, a table or a side-by-side timeline layout is more appropriate.
- Showing precise time intervals: If your audience needs to see that Step A takes two weeks and Step B takes six weeks, a scaled timeline or Gantt chart provides that information more clearly than a circle where segments appear equal.
- Hierarchical or nested content: When information is organized by level, rank, or category, a pyramid, tree diagram, or matrix layout will represent the structure more accurately.
Making an Informed Decision
Choosing the Circle Process Infographic Template V2 involves weighing the nature of your content, the expectations of your audience, and the context in which the visual will be used. Start by asking yourself: Does this process repeat, cycle, or loop back? If yes, the circular format has a natural advantage. If the process is strictly linear or chronological, a different structure will likely communicate more clearly.
Also consider the level of detail. The template is most effective when each segment contains a concise label or short description. If you find yourself struggling to fit necessary information into each segment, that is a sign that you either need to simplify the content or choose a format with more room for text. One practical approach is to use the circular diagram as a high-level overview and supplement it with a detailed written explanation or an appendix for each stage.
Finally, assess your team's comfort with design tools. If you already use Figma, Adobe XD, or Illustrator, the template will integrate seamlessly into your workflow. If you rely on simpler presentation software, you can still benefit from the design by exporting the SVG and using it as a static graphic, but you will sacrifice some ability to edit individual elements later. For teams that want to maintain flexibility, keeping the original file in one of the supported formats is advisable.
Practical Example: Using the Template for a Marketing Campaign Cycle
Imagine you are planning a quarterly marketing campaign that follows a recurring pattern: research, strategy, creation, launch, analysis, and adjustment. Each quarter, the cycle repeats, and insights from the analysis phase feed into the next round of research. A linear diagram would show the steps in order but would not convey the feedback loop effectively. The Circle Process Infographic Template V2 allows you to place each phase in a segment of the circle, with arrows or connectors showing the flow from analysis back to research. The visual instantly communicates that the campaign process is not a one-time event but a continuous cycle of improvement. You can customize the colors to match your brand, add icons for each phase, and include a short summary in the center of the circle. The result is a slide or graphic that your team can reference quickly and that external stakeholders can understand without lengthy explanation.
Final Considerations
Templates like the Circle Process Infographic Template V2 save time and improve consistency, but they are tools, not solutions. The effectiveness of any visual communication depends on how well the format matches the message. By evaluating your content against the strengths and limitations of the circular format, you can decide whether this template will clarify or complicate your presentation. For cyclical processes, interconnected stages, and recurring workflows, it offers a clean, professional structure that is easy to adapt. For linear, hierarchical, or time-sensitive content, exploring other formats will likely yield better results. Understanding these distinctions helps you choose the right visual approach for each project and communicate your ideas with greater precision.